Is my search engine marketing (SEM) marketing working? It’s the golden question that all dealers leveraging digital marketing ask themselves regularly.
Unfortunately, measuring the successes and failures of your SEM efforts is not always an exact science. It’s frustrating. We get it. However, with a little bit of organization, diligence and the right tools, you can make your ROI evaluations a lot easier and more effective. Let’s review 6.5 tips for measuring SEM ROI.
1. Set a realistic goal for what you plan to achieve with SEM
As a car dealer, it can be confusing to find your place among Tier 1 and Tier 2 campaigns. You want to complement those efforts but not compete. When setting goals for SEM, keep in mind that Tier 1, 2 and 3 goals should act like a funnel that starts with initial research and ends with influencing the shopper to visit the dealership to make a purchase.
In this shopping funnel, the dealer’s role mostly consists of the tail end of mid-funnel research, low-funnel research and low-funnel conversions. That doesn’t mean a dealer should never venture into other shopping funnel moments. It means you should first focus on “owning your backyard” before you worry about the “neighbor’s”.
For a dealer, SEM can capture shoppers showing intent in the research process of buying a car. It can follow them as they wrap up their mid-funnel research. Then it can drive low-funnel shoppers to click through to the website or make a phone call. It can even assist in driving a store visit and eventually a purchase.
In short, a car dealer’s paid search should drive more shoppers to your website so they can:
- Finish their research by viewing your price and selection
- Make a purchase decision, or at least narrow it down to the final contenders
- Connect with your dealership, whether it be via call, chat, text, form submission or to find your address so they can talk in person
2. Determine and define key performance indicators (KPIs)
Based on the goals we previously outlined (driving traffic that converts ready-to-buy shoppers) we know we need to attract quality traffic and provide a helpful experience on our site. Knowing this information, we can easily determine and define our KPIs.
Some metrics that Dealer Teamwork recommends collectively viewing to evaluate traffic quality, site experience and ultimately, the success of your PPC campaigns are listed below.
Measure actual leads (something you can act upon*):
- Conversions (store visits, calls, texts, chats, form fills)
When viewing conversions, always keep conversion window in mind. For many conversion types, a conversion can still be measured 30-45 days after the date in question. For example, if it’s December 1st and you want to see all conversions for the entire month of November, you will need to wait 30-45 days for the most accurate number. Conversions may still be logged up to 30-45 days after the last day of the month.
This is an especially important consideration for businesses, like car dealers, who have longer purchasing cycles (i.e. most customers don’t make a decision immediately to buy a car). Note the conversion window of your various metrics so that you know how long you must wait to review the complete number of conversions.
If possible, it’s also helpful to track the following metrics. You aren’t pulling these numbers from Google Ads or Analytics, but it will help show influence over time if you track them along with your SEM KPIs.
- Appointments set
- Units sold – new
- Units sold – used
From Google Analytics filtered by paid search traffic:
- Total Users
- New Users
- Sessions
Beware of defining success on individual behavioral indication metrics like average session duration and bounce rate.
An ideal session duration depends greatly on the intended goal you are trying to achieve. A very high session duration may not be in line with your goal and a low session duration can be a good thing. For example, if your goal is to capture low-funnel leads, someone spending a lot of time on your site might mean they are doing research and are not ready to connect with your dealership. So, in that case, you are not attracting the right customer for your goal with that campaign. High session duration would better fit into a campaign intended to support customers in a research phase.
Bounce rate can easily be skewed and can insufficiently track sessions depending on the types of Google Analytics “events” in place on your site (or lack thereof). As a general rule of thumb, take bounce rate with a grain of salt. Compare bounce rate to the site average for bounce rate if you value it as a KPI, and ask your web provider what types of events are in place on your site.
Behavioral indicators aren’t a bad thing to review. Just remember, there are limitations to these metrics, and they need to be viewed in conjunction with other metrics to fully glean value.
From Google Ads:
- Clickthrough rate
- Clicks
- Impressions
- Ad spend (you should track this over time so you can rule out fluctuations in budget contributing to peaks and valleys in the other KPI metrics)
You may have different goals, so your KPIs may also be different. The important things are to be consistent when possible, to measure often (at least monthly) and to look at data over time.
*An actual lead or a hard conversion is something you can act upon (store visits, calls, texts, chats, form fills). Viewing a specific type of page is not a lead. If you value these types of metrics as KPIs, they should be separated from the lead totals and evaluated separately. Page views are better tells of traffic quality and site experience quality than of a specific shopper’s intent. If you get lead metrics from a vendor, ask what they qualify as a lead to ensure you measure appropriately.
3. Set up an ongoing reporting process
The next step is to set up a method of collecting data and a plan/process for evaluating it regularly. The options here are expansive and will greatly depend on your specific dealership, team and goals.
You may find a simple spreadsheet that you update and review monthly is sufficient, or you may need something more robust that allows for cross-department collaboration and sophisticated customization. Whatever you choose, make sure it fits your situation and that it is regularly updated and reviewed.
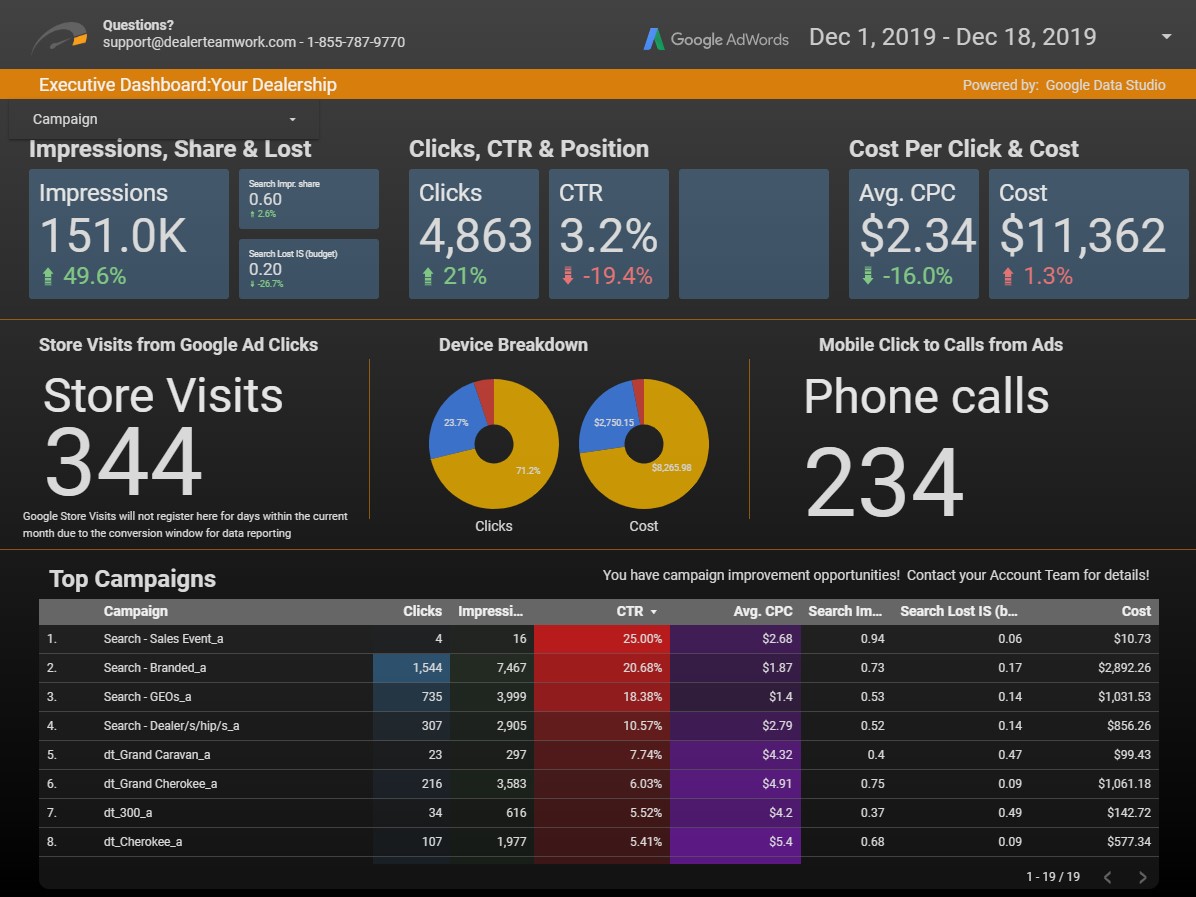
A great, free (yes free!) resource that can help automate aspects of your reporting process is Google Data Studio. Google Data Studio allows you to dynamically pull data in from a variety of sources and offers much customization. Once you set it up, Google Data Studio pulls live data into one dashboard that you can filter real-time.
An example of a way Dealer Teamwork has utilized Google Data Studio is pictured below for reference:

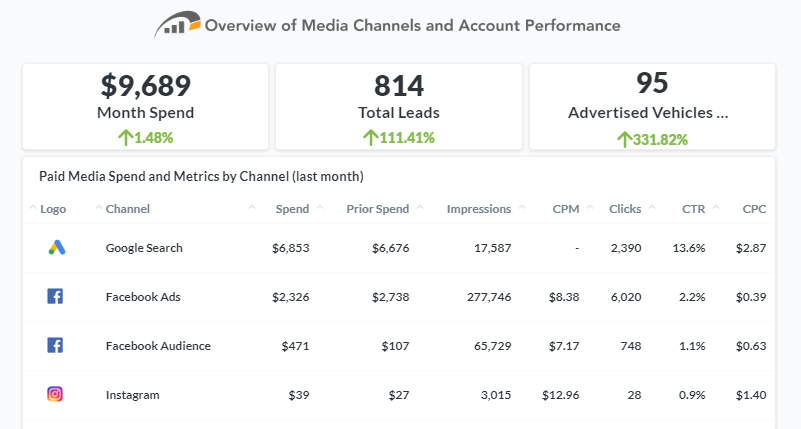
If you are a Dealer Teamwork customer, we make reporting and data analysis across all of your channels easy and fast with MPOP® Analytics. All clients have a dashboard which pulls in data from your Dealer Teamwork channels, plus you get monthly recap reports emailed to you. An example of MPOP® Analytics reporting is below:

Whether your reporting plan involves a team or not, be sure to document the process and get buy-in from potential stakeholders and contributors on roles, expectations, cadence, reporting method and evaluation processes before launching something new. Nothing kills a new process like a lack of buy-in from those involved.
4. Collect baseline data
If you are using a manual reporting/evaluation method, be sure to collect data immediately, so you have a baseline to compare to later. How do you know if you improved if you don’t know where you started? You will again want to consider conversion window here. For example, you’ll either need to backdate your benchmark 30-45 days or you’ll need to collect benchmarks with a longer conversion window 30-45 days later.
Even if you are using a dynamic reporting solution, you still may want to collect baseline data and periodically store data in some sort of roll-up report. Sometimes what’s meaningful to those on the front-line is too granular for higher leadership. You need a solution that allows you to determine how you are pacing quickly, efficiently and concisely.
Let’s say you plan to compile and review reports monthly. The baseline for that data would be the current or previous month.
5. Evaluate frequently
Reporting is only useful in determining ROI if you evaluate results regularly. A good place to start is with monthly evaluations and roll-up evaluations quarterly and/or annually.
You may also want to consider looking at trends in data. It’s perfectly normal for car dealers to have fluctuation from month-to-month. We all know that some months of the year are always harder than others.
For example, if you are down from one month to the next, it could be perfectly normal or due to factors external to your SEM campaigns. However, if you are consistently trending down month-to-month for 6 months or if you are significantly down during the same month from the previous year, that’s potentially a greater cause for concern.
Again the important things here are to pick a cadence and process and stick with it. It’s also important to have a flexible and agile reporting solution.
6. Compare to industry benchmarks and your market
When it comes to benchmarks, there are many different methods and resources you can use for comparison. You can create your own benchmarks. For example, select averages for each KPI for the year and use that as a standard next year.
You can conduct online research to find a reputable source. Be sure to vet the resources that you get your benchmark data from. Verifying data from multiple research points and sources that are transparent about how they calculate their benchmarks are often your best bet. For example, WordStream publishes annual benchmarks by industry and cites their research method.
You can also contact your SEM provider to see if they have any additional benchmark data to compare to.
For comparing to your market, OEMs often provide reports like pump-in pump-out reports or regional/market/area reports with information on how your dealership compares to other dealers in your market. These reports won’t help you directly compare to your internal PPC ROI reporting, but you can use them to see your dealership’s overall health.
For example, if you notice your sales slipping in your OEM reports, you can then turn to reports from your other internal departments that influence sales — sales, marketing, BDC, etc. If you have reporting methods in place that you measure overtime with benchmarks and KPIs, you should be able to see if any of these key departments are also trending down and diagnose from there.
6.5 Evaluate your marketing as a whole — the omnichannel approach

SEM is most likely not the only form of marketing that your dealership uses, nor should it be. These same principles can be carried over to the other forms of marketing as well. The goals and KPIs for determining ROI will not necessarily be the same across all your marketing channels, so it is important to use tools that allow you to pull your reporting into a central place for evaluation.
Here at Dealer Teamwork, we take an omnichannel approach to marketing with our patented MPOP® software and the other reporting tools we use, like Google Data Studio. If you’d like to learn more about putting SEM and omnichannel ROI reporting into practice, reach out to our product demonstration team today!


